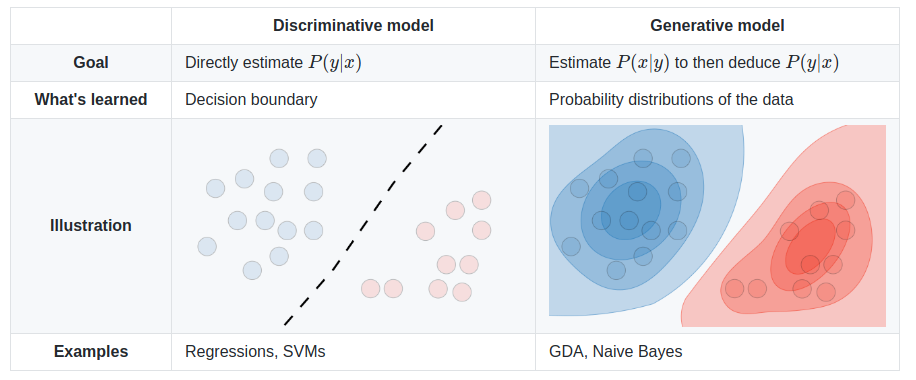
Bayesian classification is a generative model which works best when the data are clustered into areas of highest probibilty. When the data is distributed, but still has a clear bountry, SVM or Regression may do better.

Bayes Theorem expresses the probability that a test prediction will be correct. That seems simple, but there is actually a lot to it. We have some event or state which really happens. Some people get cancer, some emails are spam, etc... and those things happen with some probability. On average, 40% of us will get cancer at some point in our lives and at any given time, about 1% of the population is currently battling cancer. More than half of all email is spam. Some percentage of your tomato plants are getting too much water.
Then, we can apply a test (or tests) to an individual to help detect that state. If the test shows a positive result, now we know the chances are higher... but how much higher? The test could be wrong (a False Positive) and we need to know how often that happens. Doctors keep track of how often a test flags a patient for cancer vs how often the patient actually turns out to have cancer. You (and your spam filter) keep track of how often an important email is placed in your junk box.
If you get a cancer screening test, and it is positive, and that test is 90% accurate, does that mean you have a 90% chance of having cancer? No, because only 1% of the people actually have cancer right now, so the 10% error rate of the test is 10% of the 99% who are healthy. Your chances are actually 90% of the 1% with cancer divided by the 10% of the 99% who are healthy or about 0.9%/9.9% = ~9%. So your risk went from 1% to 9%. Not good, but a cancer screening test with only a 90% accuracy rate wouldn't be very useful. This is related to true positives and false positives, accuracy vs precision and recall.
For any case where we make a decision based on a prediction, we might right or wrong in deciding one way or the other. We might say "Yes" and be right (true positive) or be wrong (false positive). Or say "No" and be right (true negative) or wrong (false negative). If we make a chart of the possibilities, it might look like this:
| Actual Answer | |||
| Yes | No | ||
| Predicted Answer |
Yes | True Positive |
False Positive |
| No | False Negative |
True Negative |
|
In mathematical terms, Bayes Theorem says:
P(A|X) = ( P(X|A) * P(A) ) / P(X)
Where:
So how does that help us? Let's take a common example of spam filtering. We could express this as:
P(spam|word) = ( P(word|spam) * P(spam) ) / P(word)
Now, if we have a set of emails, where the user has marked the spam as spam, and we pick out one word, let's use "dollar", and made a note of which emails that word appears in, well, we have everything on the right side.
Putting all those numbers into the right side, gives us the percentage association of the word "dollar" with a spam email; the likelihood that an email is spam if it has "dollar" in it. So if we are given a new email, we can compute the probability that it is spam simply by looking to see if the word "dollar" appears in it, and if it does, this email is P(spam|"dollar") likely to be spam. Of course we need to track more than just one word, but the nice thing about probabilities is that they just multiply together.
In Python using Naive Bayes from SciKit-Learn.org:
import sys
from time import time
import numpy
from sklearn.naive_bayes import GaussianNB

### Load features_train, labels_train as numpy arrays of features and lables.
### Make features_test, labels_test as subsets of the training data for testing.

classifier =  GaussianNB()

t0 = time()
fit = classifier.fit(features_train, labels_train)
print "training time:", round(time()-t0, 3), "s"

t0 = time()
prediction = classifier.predict(features_test)
print "prediction time:", round(time()-t0, 3), "s"
print prediction

score = classifier.score(features_test,labels_test)
print score
See also:
Questions: